Example recipes#
Overview#
These are example recipes calling example diagnostic scripts.
The recipe examples/recipe_python.yml produces time series plots of global mean
temperature and for the temperature in Amsterdam.
It also produces a map of global temperature in January 2020.
The recipe examples/recipe_easy_ipcc.yml reproduces part of figure 9.3a from
IPCC AR6 - Climate Change 2021: The Physical Science Basis.
It demonstrates how ESMValTool can be used to conveniently analyze
many models on their native grid and is described in detail in the blog post
Analysis-ready climate data with ESMValCore.
The recipe examples/recipe_extract_shape.yml produces a map of the mean
temperature in the Elbe catchment over the years 2000 to 2002.
Some example shapefiles for use with this recipe are available
here,
make sure to download all files with the same name but different extensions.
The recipe examples/recipe_decadal.yml showcases how the timerange tag
can be used to load datasets belonging to the DCPP activity. Produces timeseries
plots comparing the global mean temperature of a DCPP dataset with an observational
dataset.
Available recipes and diagnostics#
- Recipes are stored in esmvaltool/recipes/:
examples/recipe_python.yml
examples/recipe_easy_ipcc.yml
examples/recipe_extract_shape.yml
examples/recipe_decadal.yml
- Diagnostics are stored in esmvaltool/diag_scripts/:
examples/diagnostic.py: visualize results and store provenance information
examples/make_plot.py: Create a timeseries plot with likely ranges
examples/decadal_example.py: visualize results and store provenance information
User settings in recipe#
Script
examples/diagnostic.pyRequired settings for script
quickplot: plot_type: which of theiris.quickplotfunctions to use. Arguments that are accepted by these functions can also be specified here, e.g.cmap. Preprocessors need to be configured such that the resulting data matches the plot type, e.g. a timeseries or a map.
Variables#
tas (atmos, monthly, longitude, latitude, time)
tos (ocean, monthly, longitude, latitude, time)
Example plots#
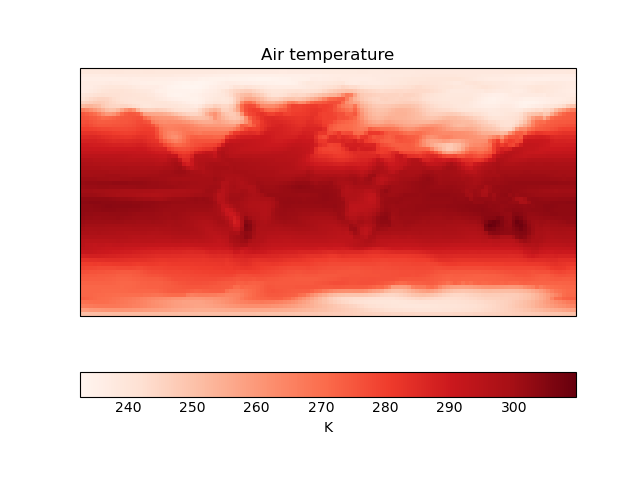
Fig. 393 Air temperature in January 2000 (BCC-ESM1 CMIP6).#
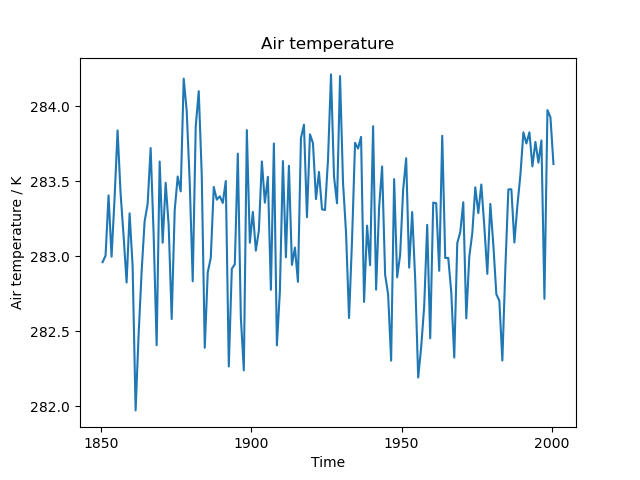
Fig. 394 Amsterdam air temperature (multimodel mean of CMIP5 CanESM2 and CMIP6 BCC-ESM1).#
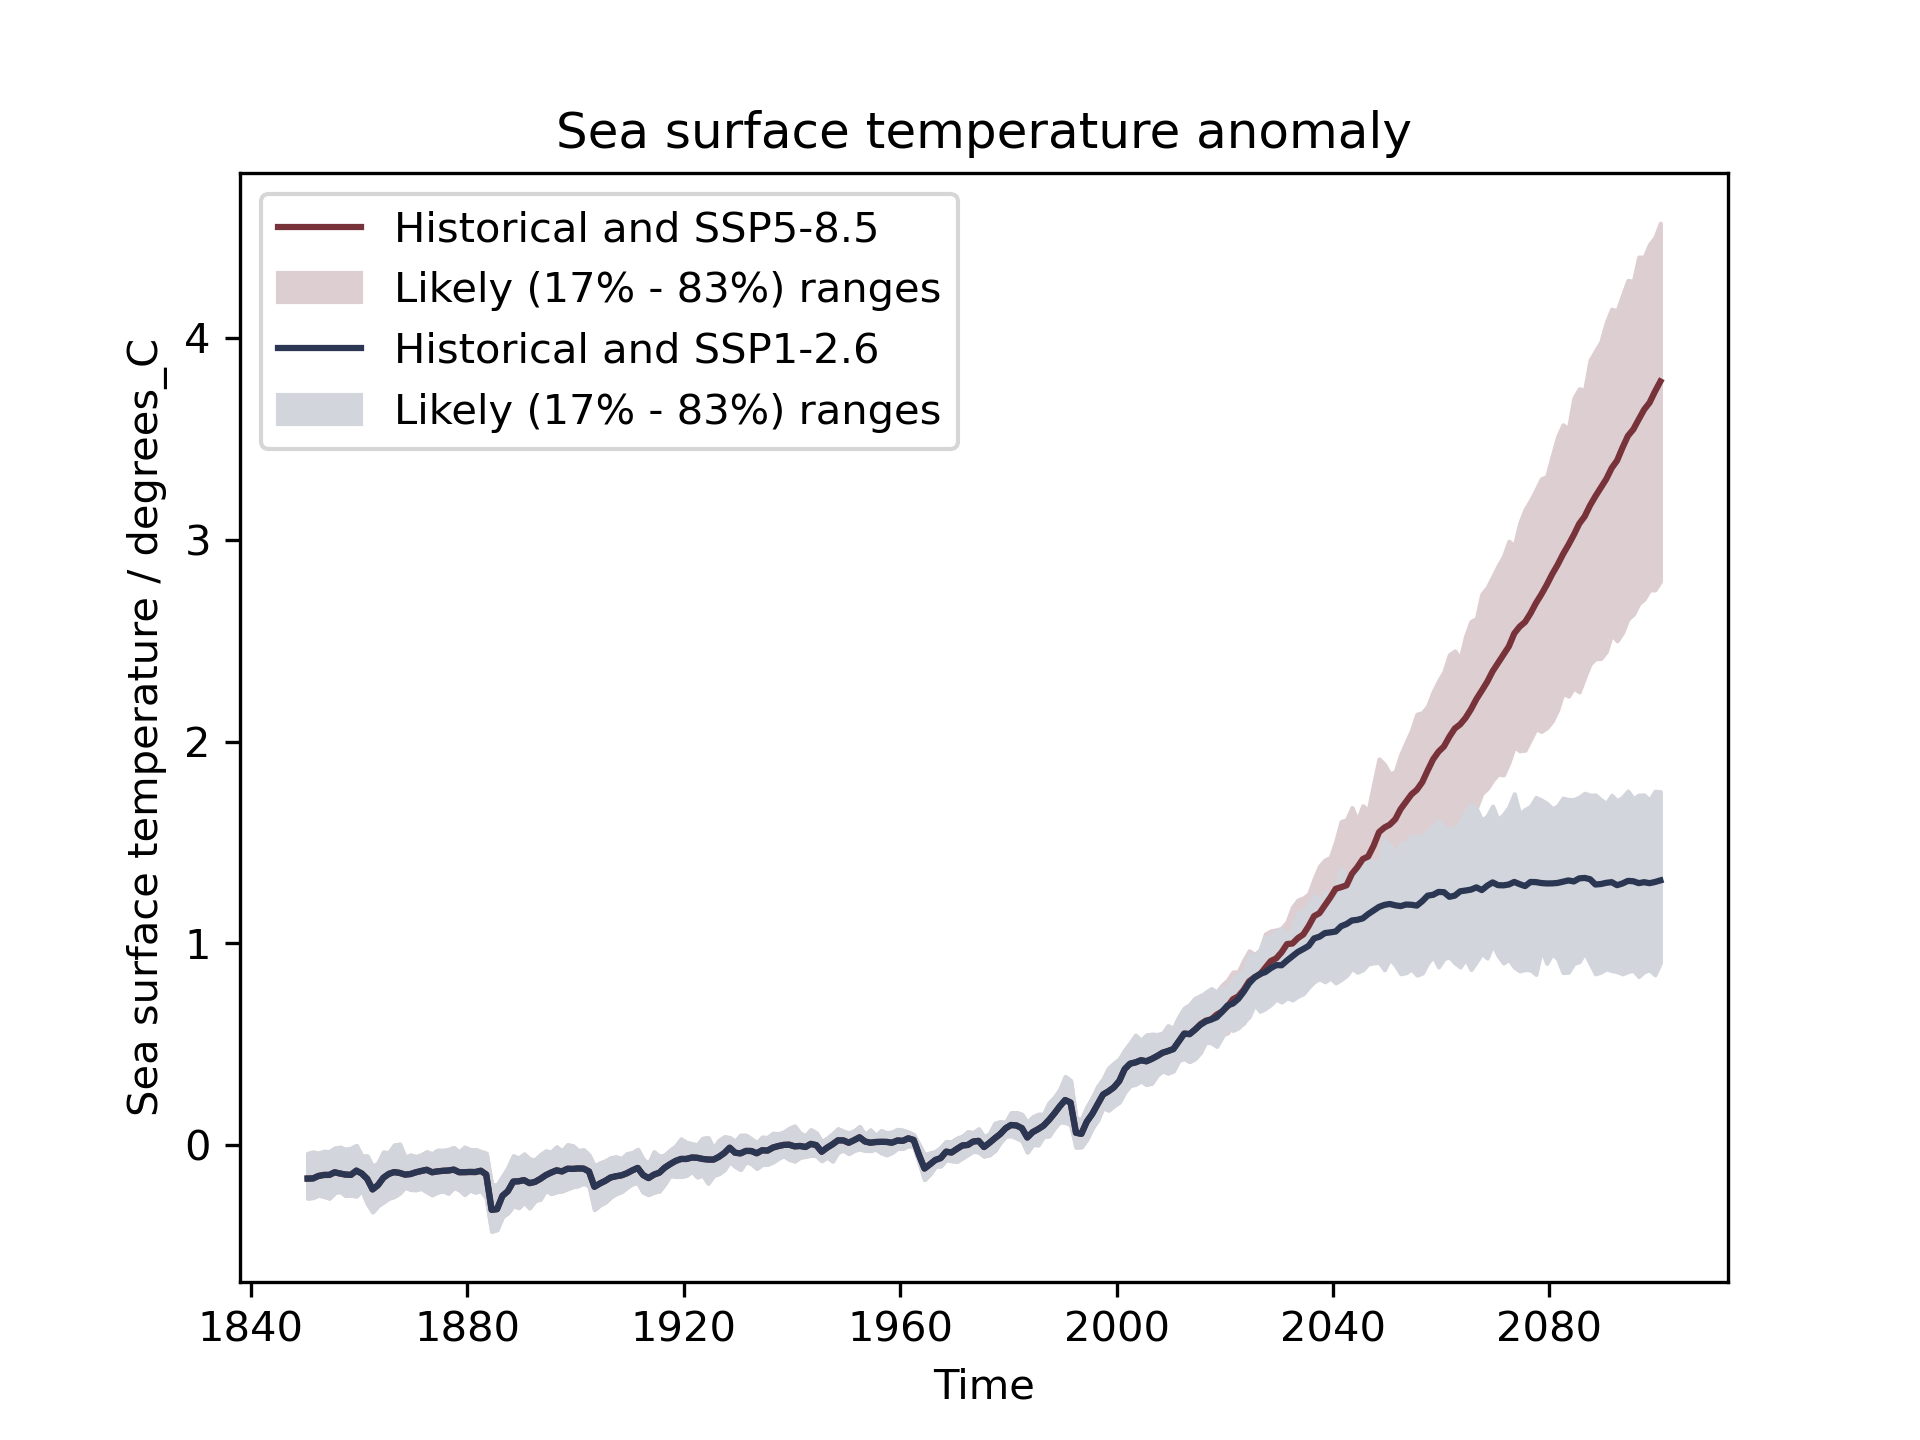
Fig. 395 Mean sea surface temperature anomaly (part of figure 9.3a from IPCC AR6).#
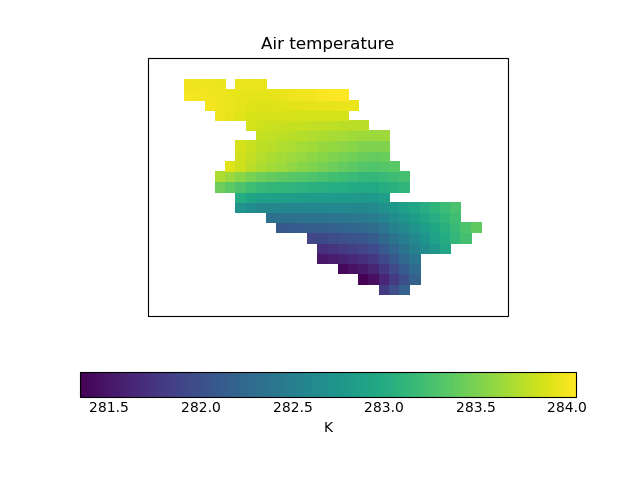
Fig. 396 Mean air temperature over the Elbe catchment during 2000-2002 according to CMIP5 CanESM2.#
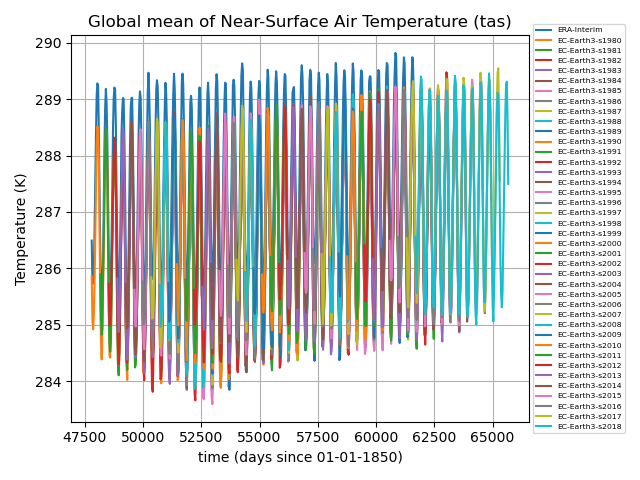
Fig. 397 Global mean temperature of CMIP6 dcppA-hindcast EC-Earth3 and OBS ERA-Interim.#