Sanity checks#
Overview#
The sanity check recipe (recipe_sanity_checks.yml) is intended to perform
some basic sanity checks for new simulations during model development. A subset of variables
is selected to check whether the model is performing in reasonable way. The recipe plots global
monthly means as well as maximum and minimum across all individual grid cells for each time step.
This can be used to check for example for negative mass concentrations occuring at any grid cell
at any time (minimum is less than zero) or whether individual grid cells exceed physically reasonable
values (e.g. total cloud fraction greater than 100%).
The global monthly means can be compared to the minimum and maximum values found in reference
datasets (observations, reanalyses) across all months and all reference datasets. The “reasonable”
limits are shown as red lines. A good model simulations would be expected to not exceed these
limits at any time. The minimum and maximum global averages across all months and all reference
datasets is calculated with recipe_create_ranges_obs.yml.
Available recipes and diagnostics#
Recipes are stored in recipes/sanity_checks
recipe_sanity_checks.yml
recipe_create_ranges_obs.yml
Note
The time frequency used in recipe_create_ranges_obs.yml (monthly, daily, etc. values) to
calculate “reasonable” minimum and maximum values must match the time frequency used in
the sanity check recipe (recipe_sanity_checks.yml).
Diagnostics are stored in diag_scripts/monitor/
multi_datasets.py: Monitoring diagnostic to show multiple datasets in one plot (incl. biases).
Variables:#
ps (air mass)
qep (moisture flux)
prw (water vapor mass)
asr
clivi
clt
hfls
hfss
lwcre
lwp
netcre
pr
prc
prw
rlds
rlut
rtnt
rsds
rsut
swcre
tas
tauu
tauv
Example plots#
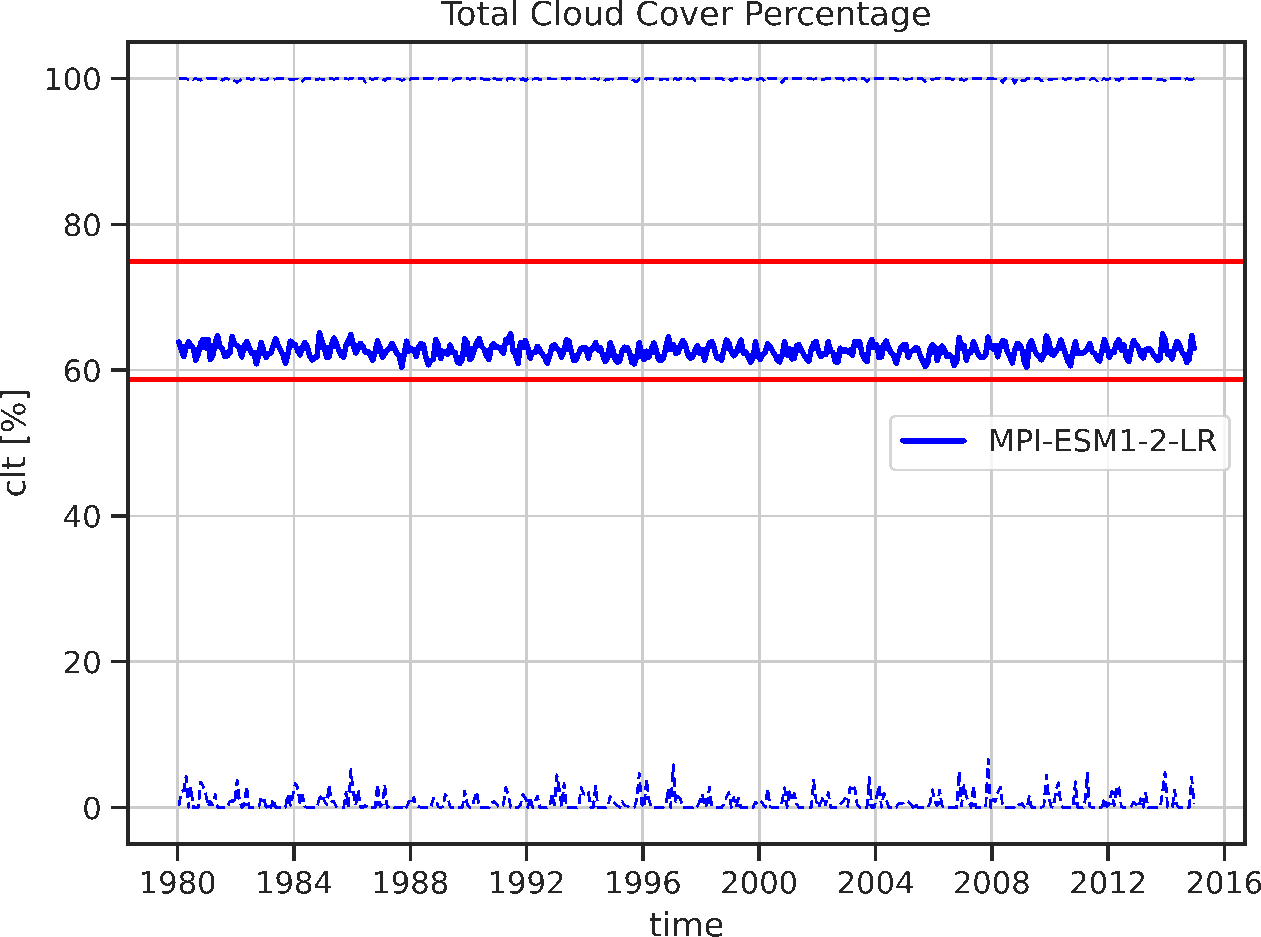
Fig. 125 Time series of monthly global average (solid line) and minimum / maximum (dashed lines) total cloud cover from MPI-ESM1-2-LR. The red horizontal lines show the monthly minimum and maximum global average across multiple reference dataset (here: ESACCI-CLOUD, CLARA-AVHRR, PATMOS-x, MODIS, ERA5) calculated with recipe_create_ranges_obs.yml. Plot created with recipe_sanity_checks.yml.#